How has the economic literature changed over the last fifteen years? The ICE-Map Visualization, introduced by Eckert et al. (2007) and described comprehensively in the dissertation of Kai Eckert (2012), lets one see such changes at a glance: it shows a whole thesaurus as a single picture and colours every concept by how its usage differs between two document collections.
A new web implementation of the ICE-Map Visualization now runs in any browser, without a server-side component. Its demonstrator applies it to the STW Thesaurus for Economics and to two samples of ECONIS, the catalogue of the ZBW – Leibniz Information Centre for Economics: 15,896 records of publications from 2008–2010 and 17,385 records from 2023–2025, retrieved through the EconBiz API. The comparison of the two periods is a good opportunity to show what the visualization can do.
Reading the Map
The ICE-Map Visualization depicts a concept hierarchy as a treemap. The size of an area is determined by the structure of the thesaurus alone, i.e., by the number of concepts below it; it does not change with the data. The colour represents the difference in information content (IC) of a concept between the two document sets. Red areas are used relatively more often in 2023–2025, blue areas relatively more often in 2008–2010. Since a document indexed with a concept also counts for all broader concepts, deviations deep in the hierarchy become visible at the upper levels, where one can spot them without knowing in advance where to look.
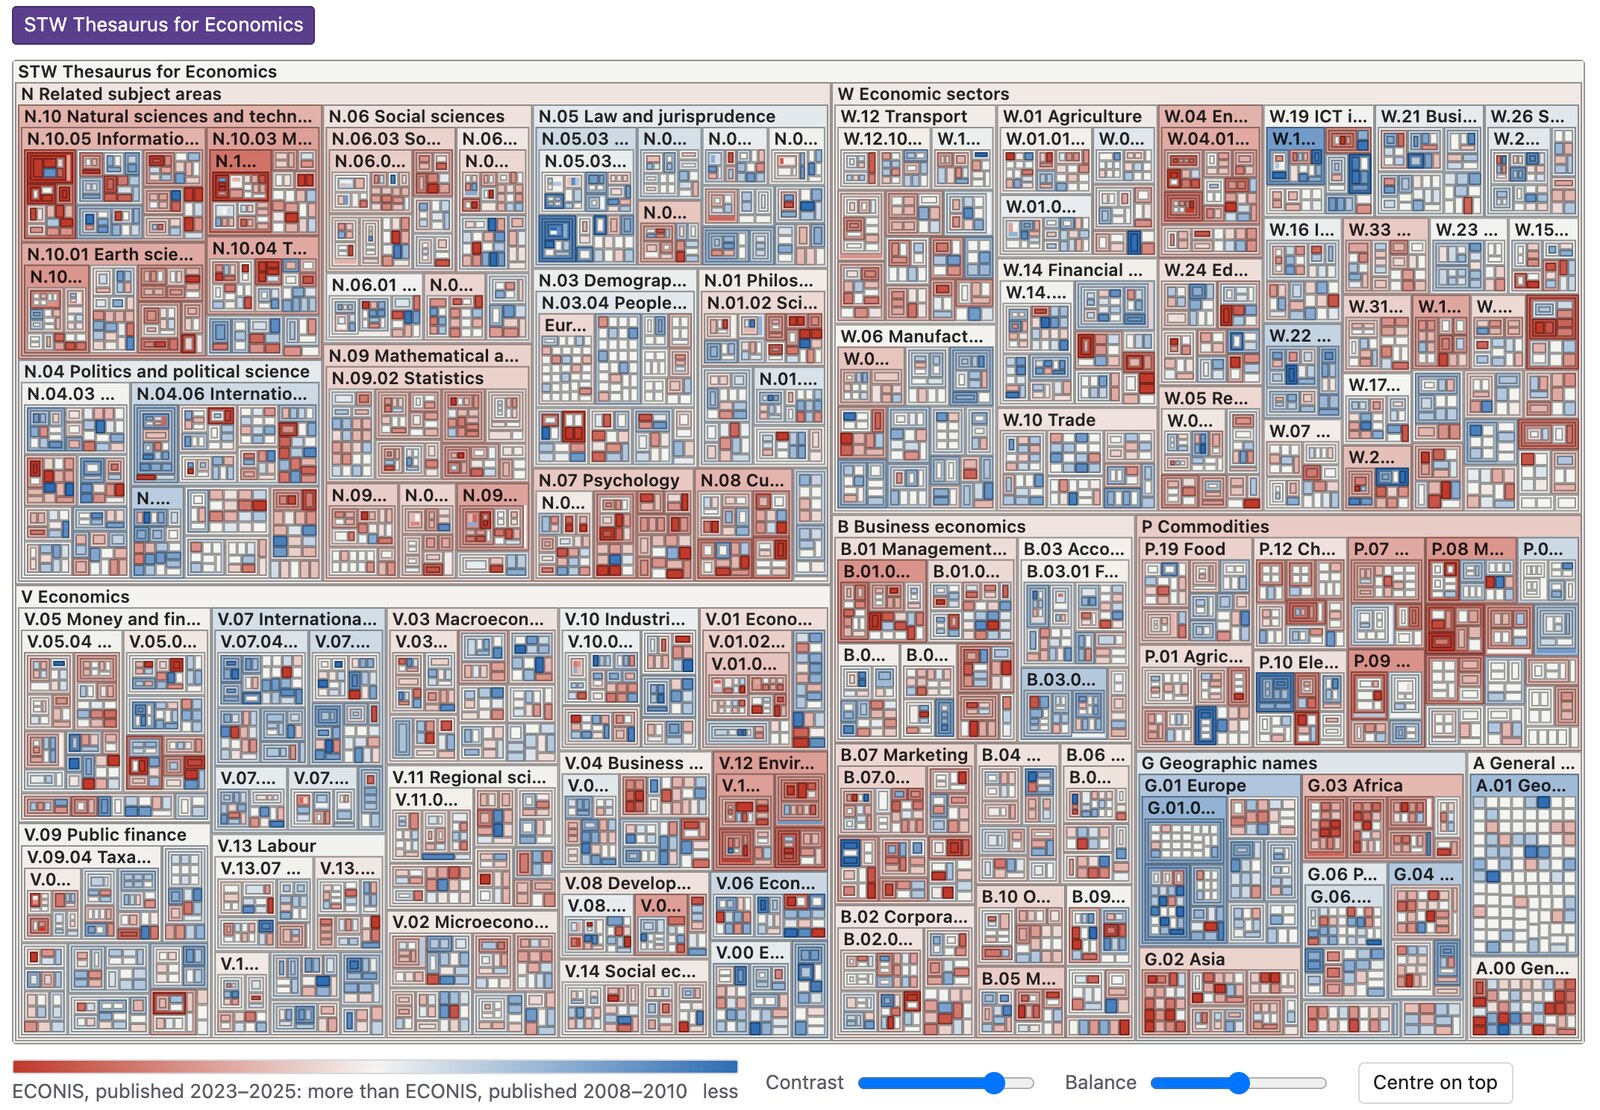
The complete STW Thesaurus for Economics (6,697 descriptors and thesaurus categories), ECONIS 2023–2025 against 2008–2010. Each image in this article links to the corresponding interactive view.
The overview shows the whole thesaurus with its seven top categories, from related subject areas (N) to geographic names (G). Even at this level, some regions stand out: the natural sciences and technology (N.10) are predominantly red, the geographic names of Europe (G.01) predominantly blue. A double-click zooms into any area, so that such first impressions can be followed down to the individual descriptors. The following four examples show how.
Example 1: Financial Sector
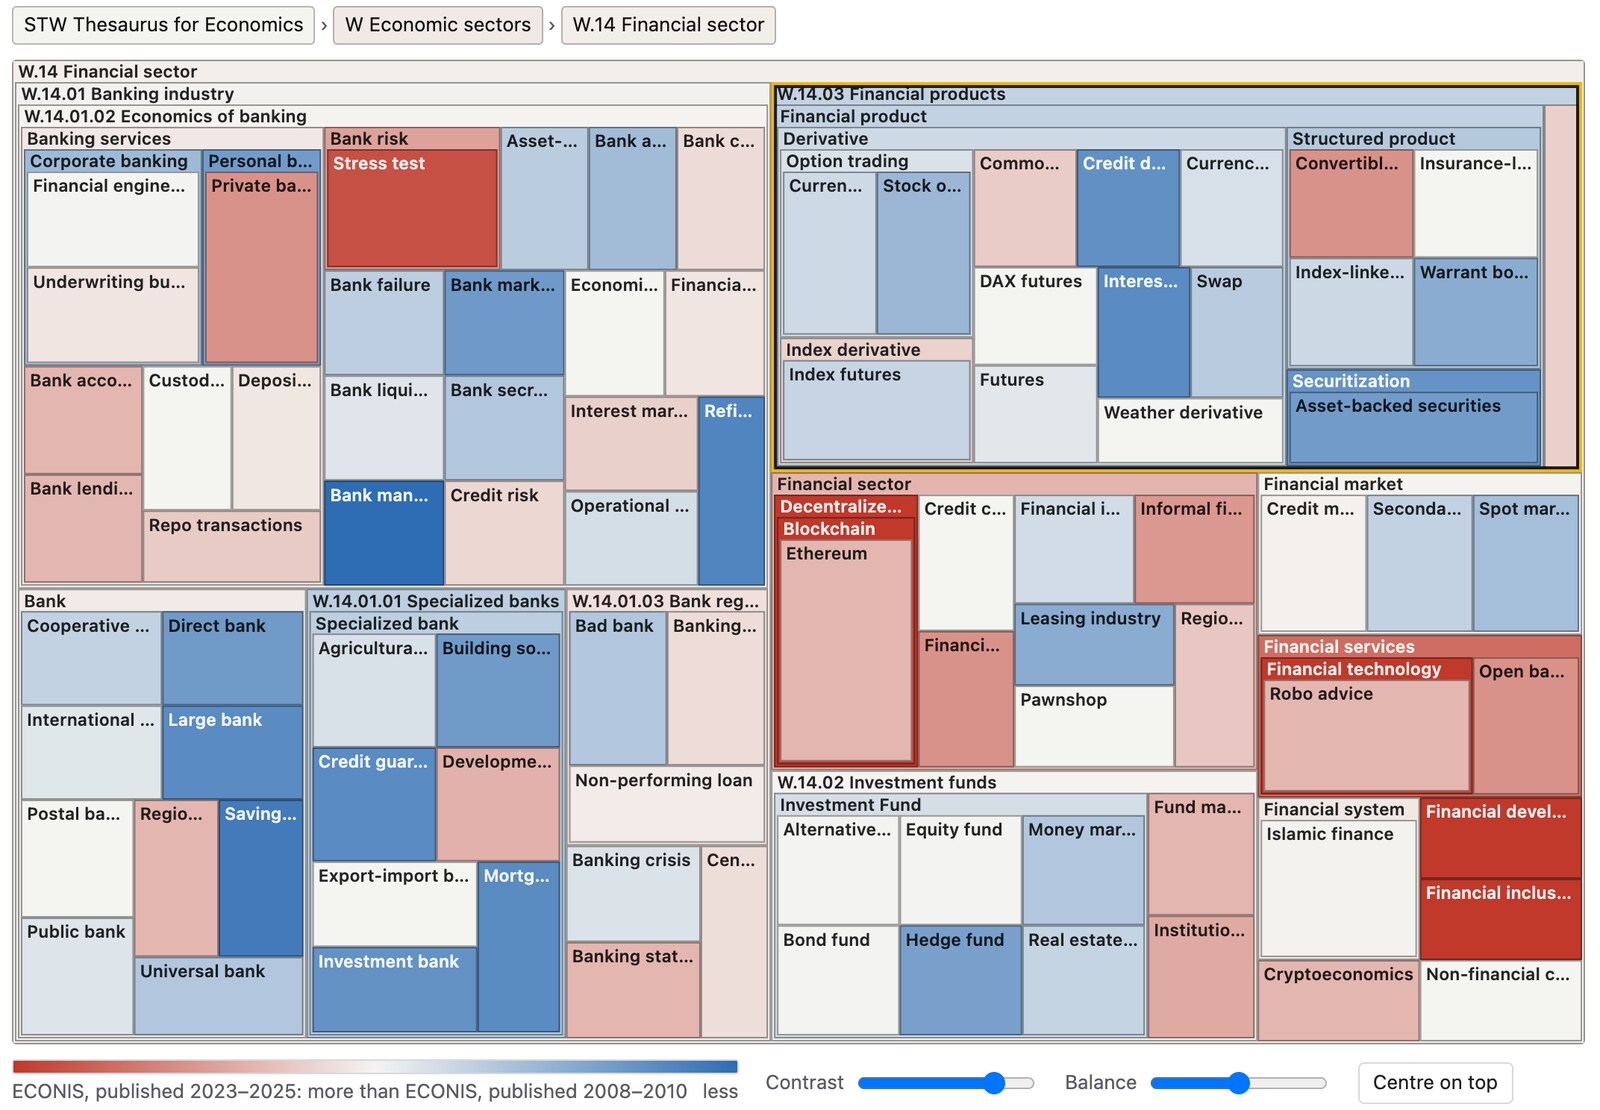
W.14 Financial sector. Blue: banking and financial products; red: financial technology, blockchain and financial inclusion.
The financial sector (W.14) as a whole appears almost neutral, but its subtrees differ clearly. The financial products (W.14.03), with derivatives and securitization, and large parts of the banking industry (W.14.01) are blue: securitization was assigned to 34 records of 2008–2010, but only to 7 of 2023–2025. In the lower part of the map, a red cluster appears instead: financial technology (0 vs. 106 records), blockchain (0 vs. 75), financial inclusion (0 vs. 82). Within one category, the visualization thus separates the topics of the period around the financial crisis of 2008 from the topics of today.
Example 2: Medical Sciences
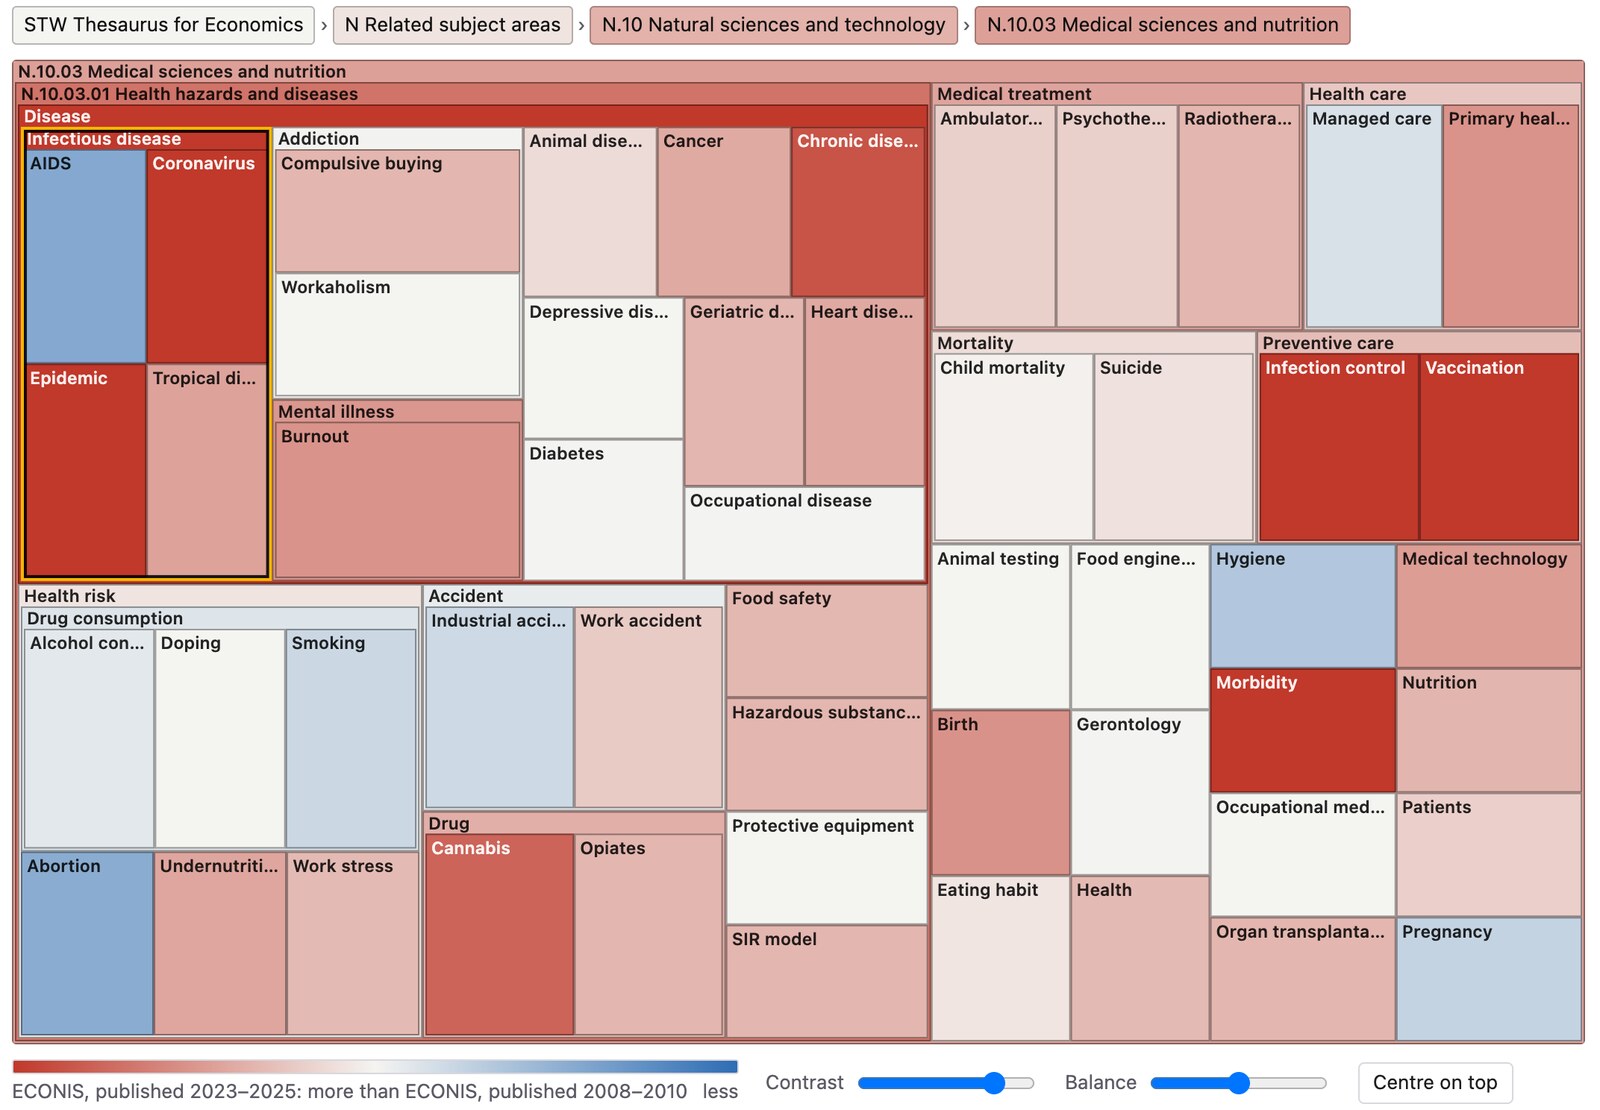
N.10.03 Medical sciences and nutrition, with the descriptor Infectious disease selected.
Health is not a core topic of economics, which makes the next example all the more conspicuous. Within the medical sciences and nutrition (N.10.03), the descriptor Infectious disease and its narrower concepts were assigned to 32 records of 2008–2010 and to 619 records of 2023–2025. The map shows the effect of the COVID-19 pandemic on the economic literature: Coronavirus (5 vs. 585 records) and Epidemic (6 vs. 236) are deep red, as are Infection control and Vaccination in the area of preventive care. Directly beside them, AIDS is blue (18 vs. 5 records). Because the counts are propagated upwards, the pandemic also colours Disease, Health hazards and diseases and the whole category N.10.03, which is how it already becomes visible in the overview.
Example 3: ICT Industry
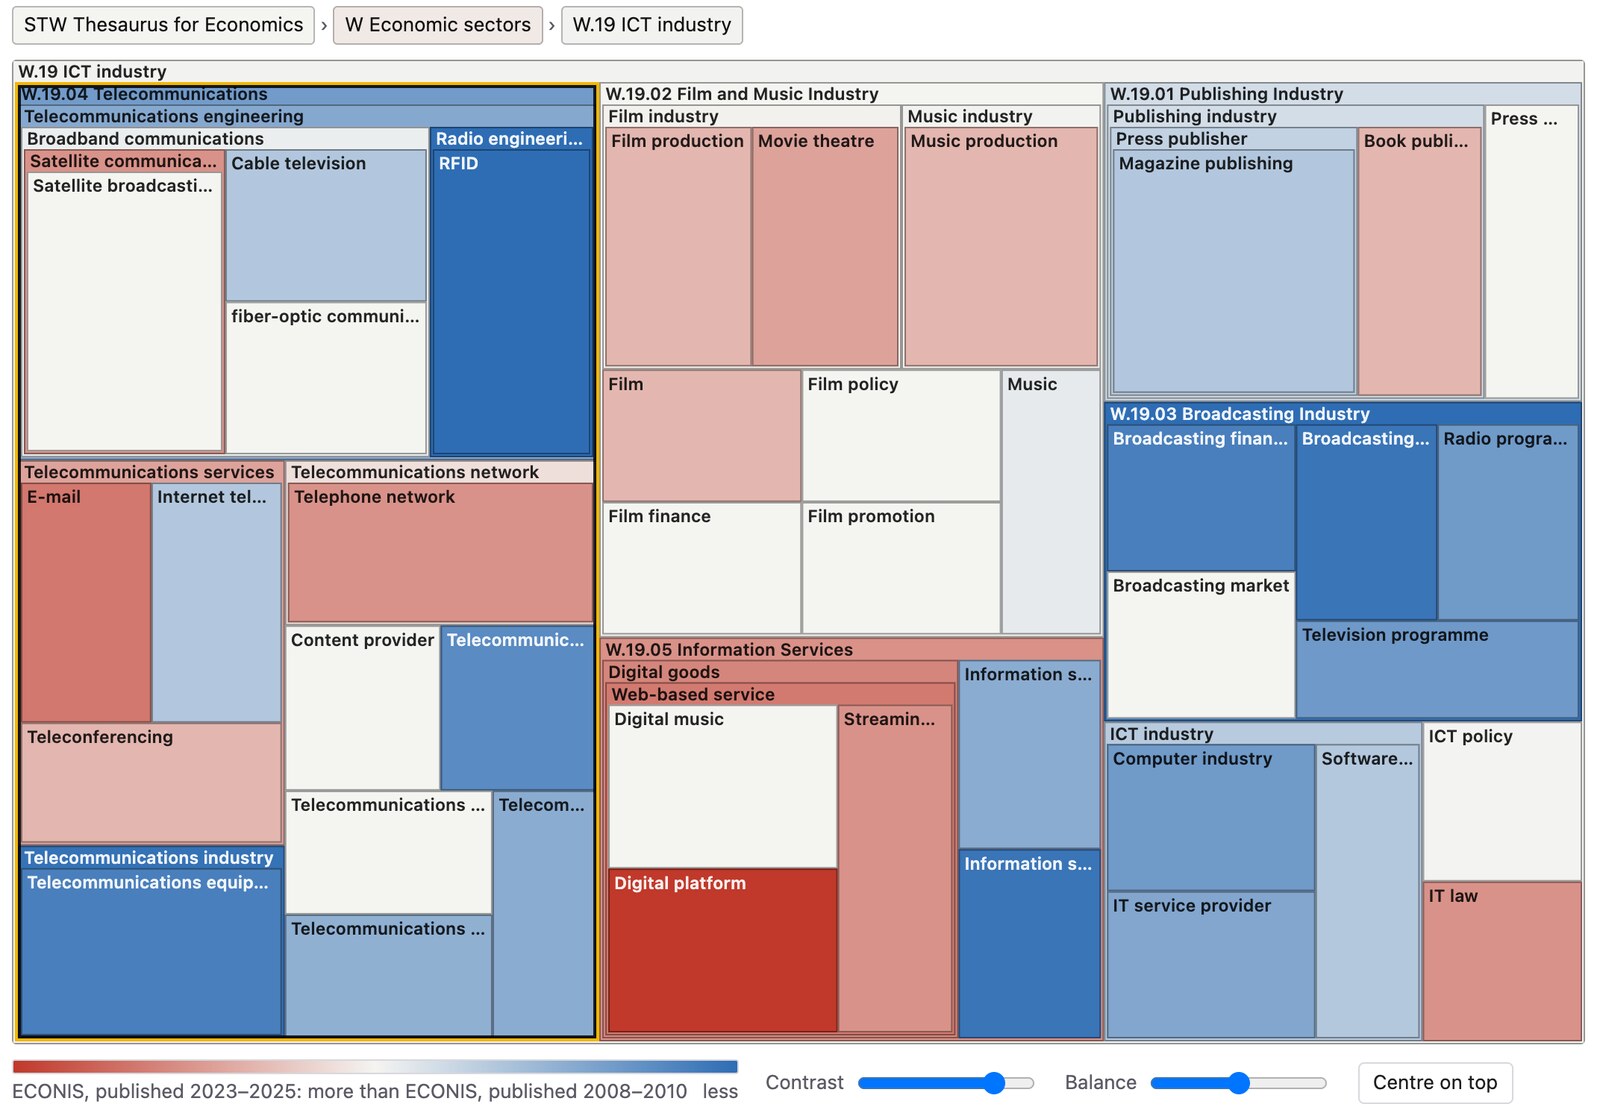
W.19 ICT industry. Blue: telecommunications and broadcasting; red: digital platforms and web-based services.
The ICT industry (W.19) shows a technological shift. Telecommunications (W.19.04, 94 vs. 24 records) and the broadcasting industry (W.19.03) are blue, with RFID (36 vs. 2 records) as the most distinct single concept. In the information services (W.19.05), the digital platforms (15 vs. 160 records) and streaming are red. Next to them, the film and music industry (W.19.02) is only lightly coloured: here, the usage changed comparatively little. Since the size of an area depends only on the structure, such unremarkable parts keep their place in the picture, and so do rarely used ones. Size and colour are deliberately independent, so that a deviation can be noticed wherever it occurs in the thesaurus.
Example 4: Geographic Names
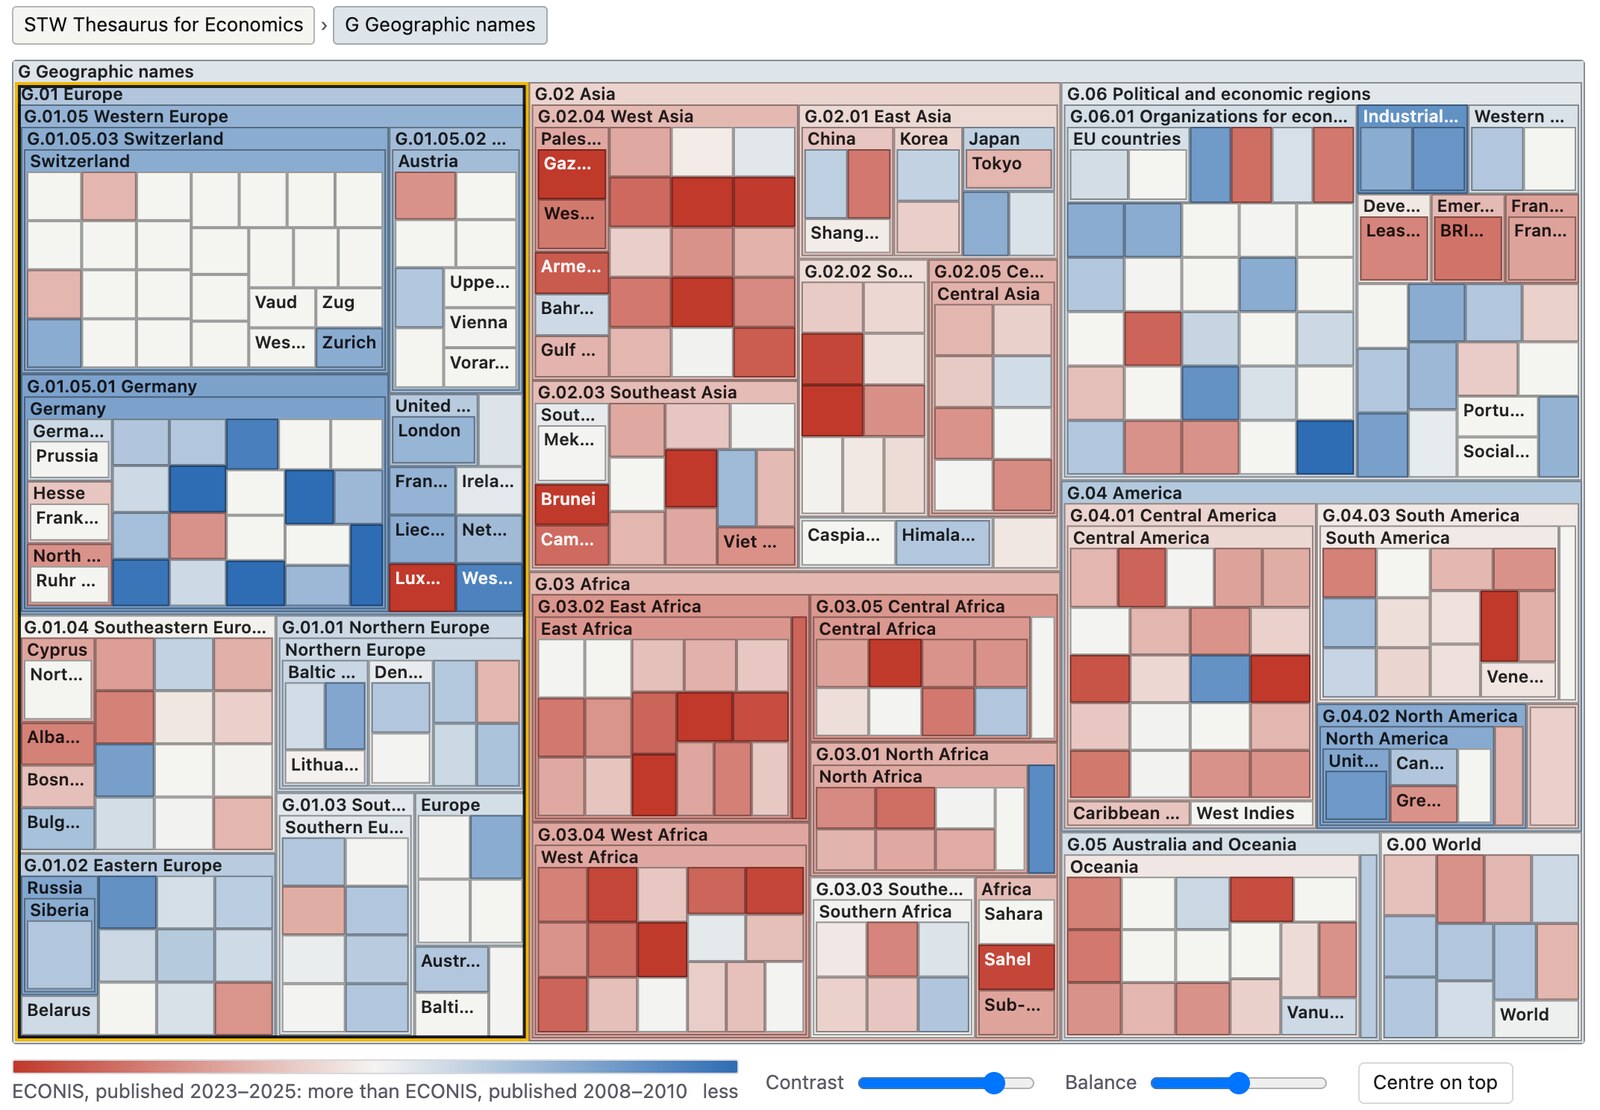
G Geographic names. Europe and North America are blue, Africa and Asia red.
The geographic names (G) are among the most frequently used descriptors of the STW. Their map divides almost cleanly into two halves: Europe (G.01, 3,574 vs. 1,900 records) and North America (1,427 vs. 486) are blue, whereas Asia (1,587 vs. 2,454) and Africa (439 vs. 911) are red, most strongly in parts of West Asia and of East and West Africa. Germany alone was assigned to 1,348 records of 2008–2010 and to 405 records of 2023–2025.
This example also illustrates the limits of what the map can tell. Whether such a difference reflects a change in the research itself, in the collection policy of the library or in the indexing practice cannot be decided from the visualization alone. The same holds for concepts that were introduced into the thesaurus only recently, and for the fact that the records of the later period carry more descriptors (5.7 vs. 4.7 per record), which shifts the colours slightly towards red overall; the balance slider of the demonstrator shifts the neutral point to compensate for this. The ICE-Map Visualization was designed for exactly this situation: it does not explain a difference, but it shows where to look, among thousands of concepts, and makes the closer inspection of the documents behind a deviation a matter of a few clicks.
Background
The ICE-Map Visualization was first presented at the Fourth International Conference on Knowledge Capture (K-CAP 2007), where the paper received the best paper award, and was developed further in the dissertation “Usage-driven Maintenance of Knowledge Organization Systems” (Eckert, 2012) at the University of Mannheim. There, it served to evaluate automatic subject indexing and to identify parts of a thesaurus that require maintenance, with the STW and the Medical Subject Headings (MeSH) as examples. The new web implementation brings these applications to static web sites; the demonstrator contains both vocabularies with current open data, including a comparison of the indexing of MEDLINE by people and by automated methods. The code is available on GitHub under the MIT license.
References
- Eckert, K., Stuckenschmidt, H., & Pfeffer, M. (2007). Interactive thesaurus assessment for automatic document annotation. In Proceedings of the 4th International Conference on Knowledge Capture (K-CAP 2007) (pp. 103–110). ACM. doi:10.1145/1298406.1298426
- Eckert, K. (2012). Usage-driven Maintenance of Knowledge Organization Systems (Doctoral dissertation). Universität Mannheim. madoc.bib.uni-mannheim.de/31754
Data: STW Thesaurus for Economics, ZBW – Leibniz Information Centre for Economics, CC BY 4.0; ECONIS records through the EconBiz API.